What is sequence stratigraphy?
Think of sequence stratigraphy as a way to read the Earth’s layered story — like flipping through pages in a very slow, rocky diary. At its core, it’s the branch of geology that looks at how sediments are laid down and how those layers group into recognizable sequences. We try to pick out and match up those units — based on where they were deposited, and the rises and falls of sea level (and other controls) that shaped them.
Why does that matter? Well, because those patterns tell us about changing environments through time — where rivers once ran, where a coastline migrated, or where a shallow sea paused and then retreated. Sequence stratigraphy gives you the language to identify and correlate those packages of rock — and, honestly, it’s surprisingly useful for practical problems, from exploration to reconstructing past landscapes.
This article aims to walk you through that story: why sequence stratigraphy matters, the basic principles and methods we use to read those layers, real-world applications and case studies that show how it works in practice, and — yes — the challenges ahead and where the field might be heading. It will be specific where it needs to be, but I’ll keep things, well, readable — so you get the gist without getting bogged down in jargon.
Importance of Sequence Stratigraphy
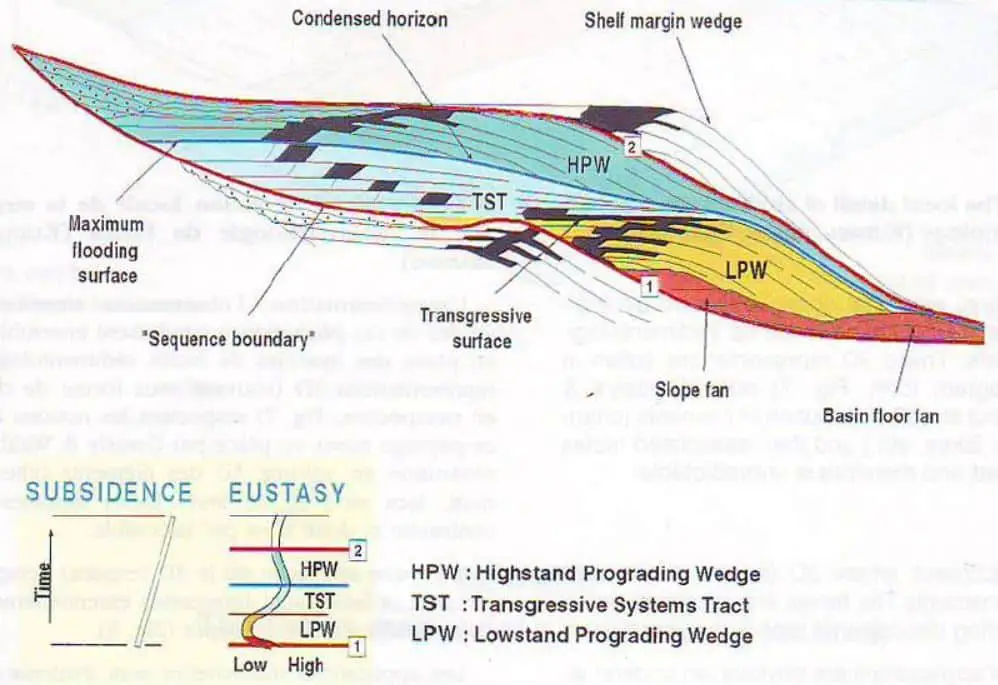
Sequence stratigraphy provides a disciplined framework for reading the stacking of sedimentary rocks through space and time. By tracing key stratigraphic surfaces—sequence boundaries, transgressive surfaces, and maximum flooding surfaces—and by organizing deposits into systems tracts (LST, TST, HST), geologists correlate units across a basin and relate them to shifts in relative sea level and sediment supply. In practice, this yields a more resolved picture of how sediments were deposited, reworked, and preserved, as accommodation opened and closed.
For subsurface prediction, the method is practical rather than abstract. Mapping systems tracts helps anticipate where reservoir-prone facies will occur, how sand bodies connect (or don’t), and where seals thin, pinch out, or step laterally. On mixed clastic–carbonate margins and large carbonate platforms (e.g., along Arabian-type shelves), the framework clarifies the distribution of shoreline trajectories, ramp geometries, and stratigraphic traps—information that directly constrains net-to-gross, flow units, and seal risk. The result is fewer surprises: wells are placed with better context; seismic attributes are calibrated to facies; step-outs and sidetracks are de-risked.
The same stacking patterns carry broader signals. Because relative sea-level change is tied to climate state and tectonics, stratigraphic sequences record icehouse–greenhouse oscillations, eustatic pulses, and longer accommodation trends. Integrated with biostratigraphy and chemostratigraphy—plus core and log data—these correlations allow reconstruction of past environments and biotic turnovers, not just locally but at basin scale. That perspective, while cautious, can inform present-day environmental assessments and restoration planning where sediment budgets and shoreline mobility matter.
Reservoir characterization benefits most when sequence stratigraphy is applied iteratively. Identifying and following surfaces through seismic and well control refines facies models; tie that to petrophysical trends, and heterogeneity becomes more predictable—never perfectly, but enough to improve development strategies. In the oil and gas context this means clearer fairway maps, better estimates of connectivity, and more realistic production forecasts; in groundwater or CO₂ storage projects, it sharpens predictions of flow paths and baffle behavior.
Sequence stratigraphy is not a single tool so much as a way of thinking: assemble the surfaces, test the correlations, revise when the data insist (they usually do). The story it produces is occasionally messy, a little redundant, and that’s fine; the Earth rarely deposits in neat paragraphs.
Principles of Sequence Stratigraphy
1- Sedimentary Cycle

Sedimentary cycles sit at the core of sequence stratigraphy. Think of them as recurring patterns in how layers pile up over time—sometimes steadily, sometimes in fits and starts—because sea level, climate, tectonics, and plain old sediment supply never stop shifting. The result isn’t one rhythm but many, braided together across space and time.
At broad scales, the shoreline moves as accommodation waxes and wanes. When sea level rises or the basin subsides faster than sediment can fill it, the system steps landward: a transgression. You’ll often see an erosional or ravinement surface at the base, then younger, more open-marine deposits stacking above, getting finer upward until a maximum flooding surface marks the deepest reach. On the other hand, when accommodation shrinks relative to supply, the shoreline progrades and we get regressive stacking—packages that generally shallow and coarsen upward, building out toward the basin and, well, making that progradational geometry everyone sketches in the margins. These broad swings nest into larger sequences bounded by key surfaces that quietly archive a history of sea-level change.
Zoom in and the pattern granulates into parasequences—smaller, shallow-upward cycles bounded by flooding surfaces. They’re the short beats within the longer song. Within a few meters you can track shifts in depositional energy, grain size, and even transport direction: a tidally stirred mudflat gives way to a sandier shoreface; wave ripples yield to hummocky cross-stratification; then back again after a flooding event resets the stage. It’s the kind of detail that feels small but telling, small but telling enough to map out process.
Why does any of this matter? Because these cycles are time-stamped records of past environments. They let us reconstruct sea-level histories and climate pulses with more confidence than a single outcrop photo ever could. For exploration, the stacking patterns help locate potential reservoirs, seals, and baffles—whether that’s a shoreface sandstone pinching out under a flooding surface or a carbonate ramp broken into tidy, shallowing-upward packets (picture a broad platform, you know, like many along the Arabian margin, stepping in and out with each pulse). And for engineering and hazard work, the way these rocks are arranged—their contacts, their fabric—governs how they behave: how slopes fail, how fluids move, how fractures connect, or don’t.
The thing is, sequence stratigraphy isn’t just taxonomy. It’s storytelling with surfaces and stacks. By reading sedimentary cycles—from basin-wide regressions down to hand-sample-scale parasequences—we get a clearer, more grounded view of Earth’s history and of the processes still shaping it today; not by a lot, but enough to make better maps, better models, and, honestly, better decisions.
2- Eustatic Cycle
Eustasy, in geology, is the name we use for planet-wide sea-level change—the global tide line lifting or lowering as a whole. Think big picture: oceans filling or emptying on scales that affect every coastline, not just one bay or one storm season.
What moves that global line? Mainly water and ice. When climate warms, ice sheets and mountain glaciers give up stored water, and the oceans rise. When climate cools, more water is locked on land as ice, and sea level falls. Simple enough—and yet, over thousands of years, those shifts add up in a way that feels anything but simple.
There’s also the ocean water itself. Warmer water expands a little, cooler water contracts; it’s a quiet push, but persistent, the kind that nudges shorelines meter by meter over long intervals, which, frankly, is not nothing.
Tectonics plays its part too. The shape and capacity of the ocean basins change as plates move. When continents pull apart and seafloor spreads fast, the bulging mid-ocean ridges take up space, effectively increasing basin volume and tending to lower sea level. When spreading slows or plates converge and basins “tighten,” the available volume decreases and sea level can rise. Different mechanism, same outcome: the line moves.
Why do geologists care so much? Because eustatic swings leave a layered record. Rising water lays down marine muds over older sands; falling water exposes surfaces to erosion, then new rivers or nearshore sands arrive. That stacking pattern—those shifts in depositional environments—helps us reconstruct Earth’s history and, very practically, predict where certain sediment bodies (including reservoir-quality sands) are likely to be. In subsurface work, a clean shoreline sand pinched between two marine shales can be a clue worth a whole field season.
The impacts reach beyond rock cores and seismic lines. Higher sea level means more frequent coastal flooding, shoreline retreat, saltwater pushing into estuaries, and lost habitat for species that need that thin edge between land and sea. Lower sea level does the opposite: shelves emerge, new land appears, ecosystems rearrange themselves in sometimes awkward ways. If you picture a broad coastal plain—say, one like the low-lying stretches along the Arabian Sea—you can see how a meter or two matters to farms, roads, mangroves, people.
So eustasy is a hinge concept: climate, ice, tectonics, oceans, all leaning on the same door. By tracking eustatic cycles—mapping ancient shorelines, tying them to strata, and testing the controls—we understand Earth’s systems better and plan smarter for the coasts we depend on. It’s patient work, sometimes slow, but the story it tells is surprisingly lively; we’re essentially reading shorelines that are, well, not here anymore.
3- Depositional Sequence

Think of a sedimentary basin like a bookshelf. Every time global sea level rises and falls, the sea stacks a new “chapter” on the shelf. In sequence stratigraphy we call those chapters depositional sequences—packages of rock laid down during a single eustatic cycle, then trimmed at the top or bottom by breaks in the story: unconformities or sequence boundaries.
How do you know where one chapter ends and the next begins? You look for the tells. Facies step shoreward, then back again. Sand gives way to mud, then returns. On seismic you’ll see onlap, downlap, toplap; in cores and well logs you’ll see stacking patterns that flip from progradational to retrogradational. Those are the fingerprints of sea-level change written right into the rocks.
Zoom in and the “chapter” breaks into parasequences—smaller pages inside the bigger arc. Each parasequence is a tidy upward-shallowing (usually) package, bookended by flooding surfaces where water deepened abruptly. The biggest of these, the maximum flooding surface, is the moment the sea pushed farthest in; it’s often a thin, fossil-rich, condensed layer and a handy time marker. Miss it and you’ll misread the plot (ask me how I know).

Why does any of this matter beyond sounding clever at core workshop? Because sequences organize risk. Lowstand systems tend to stash sand in basinal wedges and incised valleys—potential reservoirs. Transgressive shales drape across the landscape, making decent seals. Highstand deltas and shorefaces stack seaward and can deliver laterally continuous, surprisingly predictable sands. If you can trace a sequence boundary from one field to the next—correlating facies shifts, log motifs, and seismic terminations—you’re not just mapping rocks; you’re forecasting where porosity, permeability, and seal quality will actually show up.
And sure, the Earth doesn’t write with perfect grammar. Tectonics tweaks accommodation. Sediment supply surges after a stormy millennium. Local subsidence warps what should be a clean line. But the framework holds—thier, well, their utility is exactly that: a sturdy scaffold for messy reality.
So here’s a practical habit: the next time you open a well log or a seismic line, ask, Which chapter am I in? Can you circle the flooding surface? Can you point to the boundary that trims off one story and starts another? Do that, consistently, and you won’t just “interpret” a basin—you’ll read it like a book you can’t put down.
4- Sequence Boundary
Think of the rock record like an old, battered book. Sequence boundaries are the torn pages or the blank margins — places where the story of deposition pauses or gets ripped away. In geological terms, those “missing pages” are unconformities: gaps or hiatuses in the sedimentary record. They usually show up when sea level shifts or when the local depositional setting changes quickly. You can spot them in lots of ways — seismic profiles, well logs, or just by walking an outcrop and squinting at the layers.
Why do we care? Because a sequence boundary marks the start or finish of a depositional chapter. During that break, the ground that used to collect sediment might be exposed, scoured, or simply left dry while the basin goes quiet. That gap can be caused by falling sea level, tectonic uplift, or heavy erosion — basically anything that stops sediment from piling on for a while.
Geologists often sort these boundaries into types to make sense of their causes. A Type 1 boundary usually comes from a clear relative fall in sea level. Picture the shoreline moving offshore, the shelf being exposed, rivers carving down into older strata — an erosion surface forming across previously buried sediments. That’s a Type 1: exposure and erosion are the key players.
Type 2 boundaries are a bit different. They often relate to changes in sediment supply or in the space available to store sediment (accommodation). Imagine a basin that suddenly receives a huge load of material — a thick package builds up fast. Then the sediment input drops. The imbalance can produce a boundary too, even if the sea level didn’t plunge as dramatically as with a Type 1. In short: Type 1 — exposure and erosion; Type 2 — supply/space shifts that interrupt deposition.
How do you actually spot one? On seismic you might see onlap or truncation patterns. In well logs, look for abrupt facies changes or missing log intervals. In outcrop, search for an erosional surface, a soil horizon, or a sharp break between rock types. Compare the layers above and below the surface — they tell the story of changing environments and past sea levels.
So next time you stand by a cliff or skim through a core log, ask yourself: where are the missing pages? They’re not just absences — they’re clues. Read them right, and you can reconstruct how the basin breathed, flooded, drained, or choked on sediment through time.
Methods of Sequence Stratigraphy
1- Seismic Sequence Stratigraphy
Ever wondered how geologists can “see” beneath the ground without digging every meter? Seismic stratigraphy is basically that — a way of reading the earth with sound.
You send a pulse of energy into the ground (that could be a controlled blast, a vibroseis truck, whatever your field crew uses), and those pulses travel down until they hit rock layers with different densities. Some of the energy bounces back — echoes, really — and little sensors on the surface, geophones, pick them up. Think of it like tossing a stone in a pond and watching the ripples return to the shore; the timing and strength of those ripples tell you something about what lies below.
Stack those echoes from many shots and you build a seismic section — a vertical slice through the subsurface. On that slice you’ll see reflection patterns: sweeping, flat, chaotic, truncated — each pattern is a clue. Faults and folds show up as offsets or warped reflections. Changes in sediment type, thickness, or water depth change the reflection character. Put simply: patterns = history.
So how do you go from patterns to sequences? You look for consistent, repeatable reflection geometries that mark shifts in deposition — surfaces that cut across older layers, packages that repeat across a basin, things like that. Then you correlate those packages with what you already know from outcrops or well logs. It’s detective work; you match shapes and signatures until the story fits.
Why bother? Because seismic stratigraphy gives you a three-dimensional view of architecture you can’t otherwise see at the surface. It’s a staple in oil and gas — finding and mapping reservoirs — but it’s useful beyond hydrocarbons too: engineering, groundwater studies, environmental work, you name it.
Honestly, the method isn’t magic — it’s pattern recognition backed by geology. But when the data lines up, you can actually predict where good reservoir sands sit, or how a basin evolved. And that, in the end, is why we keep listening for echoes.
2- Biostratigraphy
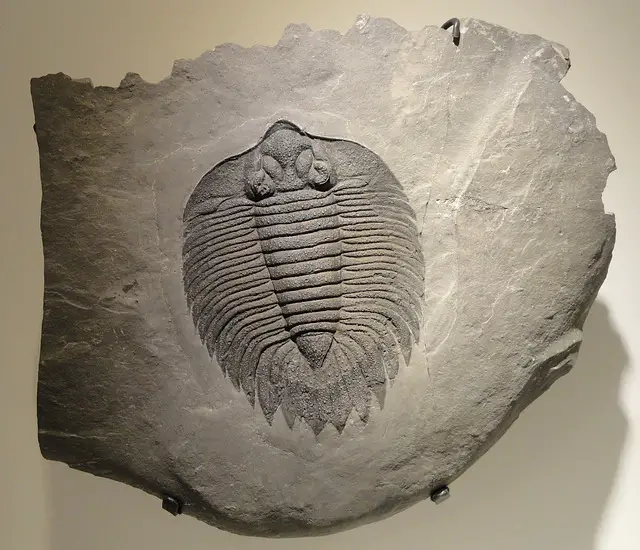
Think of biostratigraphy as archaeology with fossils instead of pottery—it’s how geologists read time in layers of rock. At its core, biostratigraphy uses the fossils locked inside sedimentary rocks as telltale signs of age. Why? Because life on Earth has a history: different creatures appear, flourish, then disappear. Those changes leave a predictable sequence in the rock record—what scientists call faunal succession.
So how does it work in practice? First, a geologist identifies the fossils in a rock sample. Then they compare that fossil mix to a reference sequence—often a well-studied place where ages are already tied down by other methods (for example, radiometric dating). If the fossil assemblage matches, you can say the rocks are roughly the same age. Simple, right? Well, mostly. There are complications—local environments, reworking of older fossils into younger sediments, and so on—but the basic idea holds.
A couple of useful concepts pop up again and again: index fossils and assemblage zones. Index fossils are species that lived fast and wide—short-lived but geographically common—so they’re great time-markers. Assemblage zones look at the whole community of fossils together; sometimes it’s the mix of species that gives you the best signal.
Why use biostratigraphy instead of, say, radiometric dating? Because most sedimentary rocks don’t contain minerals you can date radiometrically. Biostratigraphy fills that gap. It’s also the go-to tool when you need to correlate layers across different regions—find the same fossils in two places and you’ve probably found the same slice of time.
But it does more than just give ages. Fossils tell stories about the environment: were these animals living in shallow, warm seas, or in deep, cold water? Was the area swampy or dry? The types of fossils—corals, foraminifera, pollen, plant debris—help reconstruct water depth, temperature, salinity and even how nutrients flowed. And, of course, following changes in fossil groups through time helps us track evolution and extinction events.
3- Lithostratigraphy
Think of lithostratigraphy as the way geologists read a rock’s appearance — its mineral makeup, the grainy feel of its texture, the color, and those little physical signatures that make one layer different from the next. In plain terms: we study the rocks’ look and feel to make sense of how and where they were laid down. Sounds simple, right? Well… that simplicity is powerful.
The key idea is practical: layers that look the same were probably formed in similar conditions, and often around the same time. So, we group rocks into units by their lithology — that’s just a fancy way of saying “what the rock is made of and how it looks.” Then we try to match those units from place to place. Marker beds help a lot here — those distinctive, easy-to-spot layers that act like landmarks across a region.
A lithostratigraphic unit should keep the same character — the same lithology and physical traits — over its whole extent. In other words, it should be recognizably the same rock, more-or-less, whether you sample it here or a few kilometers away. Those units get bundled into bigger packages (formations, groups, etc.), based on similarity and where they sit in the rock column.
Why bother? Because lithostratigraphy works when fossils don’t. In many places fossils are missing, rare, or just hard to ID, so relying on rock characteristics becomes the pragmatic way to correlate layers. It also gives you a window into depositional environments and the tectonic story of a basin — how it filled, shifted, or was uplifted through time.
Finally, lithostratigraphy isn’t just academic. It’s a go-to tool in hydrocarbon exploration, and it crops up in environmental and engineering geology too. Put simply: when you want to map and compare sedimentary rocks — and you want to do it reliably, even where fossils fail you — lithostratigraphy is the method you reach for.
4- Chronostratigraphy
Chronostratigraphy asks a simple, practical question: when did Earth’s events actually happen, and how long did they last? In plain terms, it’s the part of stratigraphy that ties rock layers to time — it pins layers onto the geologic timescale so we can say “this layer is that old,” not just “this kind of rock is here.”
How do we do that? Mostly by measuring absolute ages — radiometric dating is the go-to tool — you read the decay of radioactive isotopes in minerals, and that gives you a clock. This is typically done by using radiometric dating techniques, to determine ages of sedimentary units and of the materials inside them (and yes, sometimes fossils and chemical markers help too).
Once we know ages, we sort layers by time. Sedimentary units of the same age get grouped into larger chunks — geochronologic or time-stratigraphic units — based on things that actually happened: the sudden appearance or disappearance of a species, a major climate swing, a big tectonic shake-up. Those events make tidy markers, the boundaries we use.
A key idea is temporal continuity: a geochronologic unit should represent a continuous span of time, more or less the same age wherever you find it. Boundaries aren’t imaginary — they’re set where the rock record shows a real change.
Why does any of this matter? Because timing changes everything. For petroleum work, paleontology, or environmental studies, knowing precisely when events occurred — and for how long — helps us reconstruct Earth’s history and, honestly, make better decisions in the field. It’s the difference between saying “this rock might hold oil” and saying “this rock formed at the exact time conditions were right for oil to form.”
So chronostratigraphy: it’s about clocks in rocks, grouping layers by time, and reading Earth’s story — a kind of timeline written in stone, with all the usual quirks and gaps, you know, like any good history.
Applications of Sequence Stratigraphy
1- Exploration and Production of oil and gas
Sequence stratigraphy is basically one of the best ways geologists read the buried past to find oil and gas. By looking at how sedimentary layers were laid down through time, you can spot where reservoirs are likely to sit, and get a feel for their thickness, continuity and quality — so you’re not just drilling blind. It saves money, speeds decisions, and yes, it bumps up the odds of a successful well.
What does that look like in practice? We pick out the key surfaces — the boundaries that break rock packages into sequences and parasequences — and tie those surfaces to real events (think sea-level shifts or big changes in how and where sediments were deposited). Once those surfaces are mapped, the distribution of facies becomes clearer: where sands pinch out, where muddy seals build up, which layers are laterally continuous enough to make a good reservoir. Simple, but powerful.
That spatial picture is what planners use to place wells and design programs. Instead of guessing at every turn, teams can target the sand-rich intervals, avoid likely non-productive zones, and refine drilling trajectories. It’s not a magic bullet, but it does reduce dry holes and helps focus resources where they matter most.
Sequence stratigraphy also surfaces stratigraphic traps — those sneaky, non-structural pockets where hydrocarbons collect because of changes in lithology or depositional patterns, or sometimes because of later deformation. Mapping those traps often means the difference between a median result and a really good discovery.
So, in short: sequence stratigraphy turns the depositional history of a basin into practical, actionable maps. It informs exploration and production choices, lowers risk and cost, and, if you look at the bigger picture, helps make field development more efficient — and a bit kinder to the environment, since fewer pointless wells are drilled. Funny enough, reading rocks patiently usually pays off.
2- Reservoir Characterization
Think of sequence stratigraphy as the reservoir’s roadmap — a way of reading layers like pages in a book. It’s not just about finding hydrocarbons. It’s about understanding how those fluids will behave once they’re down there. Why does that matter? Because the places where rock changes — the key stratigraphic surfaces — often control the routes fluids take, and they tell you where the good rock is, and where it isn’t.
When you reconstruct a basin’s depositional history, you’re basically tracing where different sedimentary facies were laid down. Those facies, and the surfaces between them, are the fingerprints of past environments — beaches, river mouths, deeper basins — and they tend to mark shifts in porosity and permeability. So, by mapping them you can predict where higher-quality reservoir rock clusters, even before you drill. It’s not perfect, of course, but it gives you a much better shot than guessing.
Porosity and permeability are the two big players for flow. The tricky bit is they vary a lot, up and down and sideways. Sequence stratigraphy helps make that patchwork less mysterious. By, mapping facies and surfaces, geologists, can outline zones that are more permeable, zones that are tight, and the thin layers that can act like seals — sometimes just a few centimeters that change everything.
There’s another practical payoff: compartmentalization. The same surfaces that guide flow can also create barriers — compartments that isolate parts of a reservoir from each other. Miss that, and you might drill a productive well next to a dry one. Plan for it, though, and you can place wells smarter, design waterfloods or other secondary/tertiary recovery schemes more effectively, and avoid nasty surprises.
So, in short — sequence stratigraphy gives you a spatial roadmap of rock types and flow-controlling surfaces. Use it to predict where the reservoir will behave well, to spot likely barriers, and to design production that actually matches the reservoir’s story. Sounds simple when you say it out loud, but honestly, when you see the layers on a good map, it all starts to fall into place.
3- Facies Analysis
Sequence stratigraphy, if you’ve ever tried to make sense of a messy outcrop at the end of a long, dusty day, is less a “method” and more a way of seeing. It’s the habit of reading rocks as chapters—each surface a dog-eared page, each facies a paragraph colored by sea level, sediment supply, and the slow insistence of tectonics. When you start there, the whole basin begins to talk back.
What makes it powerful isn’t magic—it’s the framework. Sequence stratigraphy gives you a scaffold to hang observations on: rises and falls in relative sea level, pulses of sand versus mud, the quiet tug of subsidence creating (or stealing) space. With that in mind, you’re not just labeling facies; you’re asking why here, why now? And that “why” is where depositional environments click into place.
Take a step into the field. You’re standing at a wadi cut, morning light catching faint flooding surfaces in the siltstones, and a coarser set capping the sequence like a hard lid. That’s not random. A transgressive systems tract (TST) usually whispers of rising sea level and expanding accommodation—the basin making room. Fine-grained, deeper-water or more distal sediments sneak in, often draping over older relief. The textures soften; the colors mute. Conversely, the highstand systems tract (HST) often records the moment the party’s winding down—sea level stabilizes or even falls a little, accommodation tightens, and coarser, shallower deposits prograde out. Shorelines step basinward; sand grows bolder. You can feel that forward push in your boots.
Why obsess over these shifts? Because environments control facies, and facies control properties. A tide-influenced sand flat won’t behave like a storm-dominated shoreface; a lowstand incised valley fill doesn’t flow like a neat shelf sheet. Map the systems tracts and key stratigraphic surfaces—flooding surfaces, sequence boundaries, maximum flooding—and you’re effectively drawing the traffic map for sediment. It’s not just “where is the sand,” it’s “where did the sand go when the rules changed.”
And yes, those rules change with more than just sea level. Climate tweaks sediment supply—the same catchment will deliver a very different load in a wetter regime than in a dry spell. Tectonics tilts the table: uplift pinches accommodation, subsidence opens it up. Put them together and you get the basin’s heartbeat. Once you hear that rhythm, reconstructing past environments stops feeling academic and starts feeling inevitable.
Here’s the practical part (the part our industry cares about, honestly). When you can trace facies belts along sequences—say, shoreface sandstones pinching out into offshore muds, or a carbonate ramp shifting upslope during a transgression—you’re not only building a beautiful model; you’re narrowing the search. Reservoirs often track those laterally continuous, coarser bodies in HST shorefaces or lowstand wedges; source rocks love those starved, organic-rich intervals near maximum flooding. The same logic helps with groundwater, too—identifying connected, porous units and their seals in aquifer systems. It’s one framework serving multiple decisions.
A quick metaphor I can’t resist: think of accommodation like a dimmer switch, not an on/off button. Turn it up (more space), and the room fills with finer notes—muds, deeper-water tones, a quieter melody. Dial it down, and the bass kicks in—coarser grains, shallower energy, progradation. Sequence stratigraphy is you standing at the switch, listening carefully to how the song changes.
Of course, nothing is ever perfectly neat. Boundaries can smear, facies can misbehave, and real basins break rules when nobody’s looking. That’s okay. Small mismatches are where the good questions live. If a sand tongue shows up where you expected mud—ask why. Was there a local high? A river mouth sneaking in sediment? A storm window that opened just long enough to matter? Those little detours are clues, not errors.
So, the next time you’re logging core or scanning an outcrop (maybe somewhere along an Oman coastal plain or out near the Huqf flats), try this:
- Mark the surfaces first—every sharp shift, every flooding gloss.
- Group the story into TST, HST (and don’t forget lowstand when you see incision).
- Trace facies belts along those tracks.
- Then, make one brave prediction about where a reservoir-quality body should thicken or pinch out. If you can test it tomorrow, even better.
Because in the end, sequence stratigraphy isn’t about memorizing acronyms; it’s about hearing the basin’s voice. And once you hear it—just once—it’s hard to un-hear. You start noticing the small commas in the rock record, the ones you missed before. And that, honestly, is where the real work (and the fun) begins.
4- Paleoenvironmental Reconstruction
Sequence stratigraphy, when you really sit with it, is less a single technique and more a way of seeing patterns in messy rocks. By mapping depositional environments and tracking how sedimentary facies shift through space and time, geologists tease out the story of past landscapes—shorelines stepping landward, river systems switching course, carbonate platforms flooding and then breathing back to life. It’s the difference between a stack of beds and a narrative you can follow: a flooding surface here, a lowstand wedge there, a maximum flooding surface you can trace from a roadcut to a well log and, if you’re lucky, across a seismic line that actually behaves.
What does that get us? Quite a lot. Those stacked packages let us reconstruct paleoenvironments and the controls behind them—sea-level changes, sediment supply, subsidence, and yes, climate. Ash layers pin a moment in time; geochemical shifts (think δ¹³C wiggles or subtle clay mineral changes) hint at greenhouse spikes or volcanic pulses; even the geometry of parasequences can whisper about accommodation space. Picture a coastal sabkha edging the Arabian Sea: thin tidal flats, evaporites feathering into shallow-marine carbonates, then—almost abruptly—a transgressive blanket that isn’t exactly the same everywhere, but close enough to follow. That’s the kind of “map” sequence stratigraphy makes possible.
Human footprints show up in the record too, sometimes more quickly than we expect. Dams starve deltas, land-use changes thicken flood layers, pollution leaves persistent chemical signatures, and microplastics—unfortunately—become tiny time-stamps in young sediments. In arid systems, a handful of intense floods can stack coarse pulses into wadis that look, at first glance, like climate talking when it’s partly us. By identifying shifts in facies and surfaces through these intervals, we can separate natural variability from anthropogenic signals and start to ask better questions: how fast did the system respond, and how long do the effects linger?
On the resource side, the same logic guides where fluids live and how they move. Reservoirs, seals, baffles, and barriers are not random; they’re organized by surfaces—sequence boundaries, transgressive surfaces, maximum flooding surfaces—that partition rock into flow units with different personalities. Map those surfaces carefully and you improve predictability: where a channelized sand might pinch out into muddier, tighter facies; where a carbonate shoal builds good porosity under a flooding cap; where a stratigraphic trap outperforms a structural one. That translates, in practical terms, to smarter exploration, fewer surprises, and recovery strategies that match the rock rather than fight it. Honestly, fewer dry holes is not exactly a bad outcome.
There’s a deeper payoff too. Stacking patterns in forelands, on passive margins, and along rifted coasts record the push-and-pull of tectonics and erosion—uplift, subsidence, flexural loading, thermal sag. Even big events, like obduction or rapid uplift along mountain fronts, echo through the stratigraphy as unconformities and abrupt facies jumps. Over geological time—over deep time—the archive becomes a ledger of process: how sediment got from source to sink, and why the pages look the way they do.
In short, sequence stratigraphy helps us see patterns where, at first, there was only rock, and by doing so it links climate history, the evolution of life’s habitats, human impacts, basin resources, and the long arc of Earth-surface change. It’s broad in application—energy, water, environmental forensics, climate reconstructions—but specific in practice: surfaces you can trace, facies you can defend, correlations that hold up when the next core comes in and the next seismic line rolls out. And if the picture isn’t perfect on day one—well… that’s geology; the next outcrop usually adds a useful wrinkle, sometimes the very wrinkle you were missing.
Case studies of sequence stratigraphy
1- Gulf of Mexico
The Gulf of Mexico sits like a big, patient archive, a thick sedimentary stack that quietly keeps time—millions of years of it—through rises and falls of sea level and the push-and-pull of tectonics. Geologists have spent decades here working out the story with sequence stratigraphy; honestly, it’s hard to imagine the region without that lens because the stratigraphy looks complex at first glance and then, well… it starts to make sense.
At its core, the Gulf is arranged in depositional sequences bounded by surfaces that mark real shifts—abrupt steps in relative sea level, sometimes subtle on logs but crisp on seismic. Those sequence boundaries help bracket where reservoir-prone intervals might sit. Within each sequence, you watch facies tilt from transgressive to regressive systems tracts, as shorelines step landward and then pace seaward again. Zoom in, and the architecture breaks further into parasequences: shorter beats—thin-thick-thin—each one reflecting a nudge in sea level or a hiccup in sediment supply.
What does that mean in the subsurface? For exploration, quite a lot. If you can pick the major boundaries and the stacking patterns of systems tracts, you’re not just drawing pretty lines—you’re predicting where sand gets trapped, how thick it runs, and whether it’s likely to be clean or shaley in the places that count. The thing is, reservoirs cluster where accommodation and delivery line up: lowstand wedges at the shelf edge, shoreface packages in forced regressions, or those slightly pinched deltas that leave behind stubborn but sweet spots. On the other hand, maximum flooding surfaces, often shale-rich, can spread like quiet blankets—regional seals in waiting.
Once discoveries are made, sequence stratigraphy doesn’t step offstage; it changes jobs. It becomes the map for fluid flow. Key stratigraphic surfaces can baffle or baffle less (sometimes they surprise you), and parasequence boundaries compartmentalize in ways that only show up after a few months of production data. Spatial patterns in porosity and permeability usually track facies: coarser, better-sorted shoreface sets tend to breathe, while muddier transgressive lags can tighten things up. Funny enough, a thin condensed section—so easy to skip on a busy log—may control pressure communication across an entire field.
There’s also the bigger picture: sequence stratigraphy helps reconstruct how the Gulf breathed through time—what the shoreline did, how deltas pulsed, and when the basin tipped from gentle shelves to deepwater delivery. When you line up the sequences and their systems tracts, you can read past climates in the stacking and in the fossils tucked into those flooding shales. It’s not just academic; the same signals that built reservoirs also record the tempo of Earth’s climate machine, and—quietly—the way sediment routing shifts when landscapes change.
In the end, exploration and development both run smoother with that framework in hand. You use it to screen prospects, to constrain thickness trends before a well is even spudded, and later to manage reservoirs—tuning injector-producer patterns to the real geometry, not the wishful one. And if a field underperforms, the postmortem often circles back to a missed surface, a misread tract, or a parasequence set that stacked just a little more landward than expected.
So yes, in the Gulf of Mexico, sequence stratigraphy is both the compass and the map. It helps find and size reservoirs, explains why they behave the way they do, and anchors our reconstructions of the basin’s past. Essential is a strong word, but here it fits—because without that scaffold, the story frays, and with it the story holds.
2- North Sea
The North Sea sits among the classic hydrocarbon provinces—busy, complicated, and, well… surprisingly readable if you think in sequences. Decades of work there have turned sea-level beats and glacial pulses into a kind of ledger that geologists can flip through, page by page. It isn’t just academic. It’s how we map where the sand went, and why it stayed.
Reservoir hunting, in practice, starts with the everyday shapes of sediment: river channels that wander and stack; deltas that lurch forward then stall; shorefaces that step landward on a rise and seaward on a fall; and, out in deeper water, those turbidite lobes that thicken in just the place you hoped. In the North Sea you see all of it—fluvial, deltaic, shallow marine, deep marine—and each environment has its telltale facies. Once you pin down the sequence boundaries, the flooding surfaces, the lowstand wedges and the transgressive blankets, you can start to predict where the better-quality sand bodies concentrate, how thick they might be, and how well they connect. (Sometimes it’s almost unfair how a single maximum flooding surface turns into a perfect correlation line across a field.)
And reservoirs don’t just sit there; they behave. Sequence stratigraphy helps you figure out why one zone flows like a dream and the next one sulks. Flooding shales become baffles, thin marine muds become barriers, and parasequence stacking quietly decides where a waterflood front will run straight… or curl off to the side. You map the key surfaces that control connectivity—then you plan completions, horizontals, even injector–producer pairs with a bit more nerve. It’s the difference between “we think” and “we know enough,” which, honestly, is kind of the whole game.
History matters, too. The basin’s depositional story isn’t smooth; it’s a stop–start rhythm of subsidence, halokinesis in places, and those glacial episodes that carved and filled and carved again. Glacial deposits and erosional cutouts in the Quaternary record tie back to sea-level swings and climate pulses; sequence frameworks give them timing and shape rather than leaving them as scattered facts. On the other hand, longer-term shifts—delta progradation, shoreline back-and-forth (back-and-forth is exactly how it felt)—show up as stacked systems tracts that read almost like paragraphs in a field report.
Funny enough, the more you zoom in, the more the big picture sharpens. A thin shale you can barely see in core turns into a field-scale marker; a subtle downlap becomes the reason a lobe pinches exactly where your seismic said it would. You know the drill: tie the wells to the lines, walk the surfaces across the block, then adjust the model when reality, not so politely, disagrees.
All told, sequence stratigraphy is the framework that keeps North Sea geology from being a pile of unrelated stories. It’s how teams flag prospective sands before they drill, and how they squeeze a little more recovery out of the reservoirs they already know—by understanding which surfaces connect, which ones seal, and which ones only pretend to. Not perfect, but practical; precise enough to matter in exploration, and flexible enough to guide production when the reservoir shows its quirks.
And that’s the point: a map of sequences becomes a map of risk and opportunity. It’s technical, sure, but it’s also, oddly, human—because it accepts the basin as it is: layered, a bit messy, and still readable if you take your time.
3- Western Interior Seaway
If you picture North America in the Late Cretaceous, you don’t start with mountains—you start with water. A long, shallow sea sliced the continent in two, running from the Arctic all the way down to the Gulf of Mexico. The Western Interior Seaway wasn’t just big; it breathed with time. Shorelines shifted, muds gave way to chalks, sands pinched out then returned—layer upon layer, upon layer—as sea level rose and fell.
Those rises and falls weren’t random. They tracked with global tectonics and climate, so the basin recorded a set of depositional sequences that repeat in a familiar rhythm: transgression, then regression, then back again. In the rocks, you can see it in the stacking patterns—condensed sections, flooding surfaces, progradational wedges that suddenly step seaward. It’s the kind of pattern you start to feel in your bones after a few measured sections, honestly.
Sequence stratigraphy gives us a way to make sense of that breathing. We map key stratigraphic surfaces—sequence boundaries, maximum flooding surfaces—and use them to correlate across the basin, from Alberta down through Wyoming and the High Plains to Texas. Funny enough, once you lock onto those surfaces, the story tightens: chalky, open-marine intervals thicken where accommodation was high; shoreface sands bite landward when accommodation fell or sediment supply surged. The thing is, that framework lets you see both the forest and the trees: regional sea-level shifts and the local quirks of sediment supply braided together.
If you’ve stood below a cream-white cliff of Niobrara Chalk in Kansas or traced the darker, shaly rhythms of the Pierre Shale farther north, you know the Seaway’s mood swings. Quiet-water deposition leaves soft, friable chalks that crumble in your hands; stormier or more restricted settings lay down muds and silt with shell hash and tempestites tucked in. And, well… a thin glauconitic lag at a flooding surface says more than a paragraph ever could.
Life in that sea was anything but quiet. Ammonites, belemnites, and mosasaurs cruised the water column, and their remains settled into those same sequences we use for correlation. By tying fossil zones to sequence boundaries and flooding surfaces, paleontologists have stitched together timelines that track how faunas expanded, retreated, and sometimes blinked out as environments shifted. Correlate a flooding surface across the basin, pick the ammonite zones riding just above it, and suddenly the tempo of evolution and migration stops being foggy and becomes, surprisingly, crisp.
Put together, the Western Interior Seaway reads like a layered ledger of the Late Cretaceous on this continent. Sea level, sediment supply, climate—each left signatures we can still follow: third-order cycles stepping through chalk-marl couplets, regressive sand bodies nibbling basinward, condensed sections whispering of deepening water and low sediment flux. It’s technical, yes, but not sterile; the rocks feel lived-in. And if a misplaced comma in a field note, or a slightly awkward phrase sneaks into a measured section description—that’s all right. The sequences are the point, and they still line up from the Arctic to the Gulf. You can almost hear the sea breathing.
Challenges and Future Directions of Sequence Stratigraphy
Limitations of Sequence Stratigraphy
Sequence stratigraphy is a solid framework for making sense of layered rocks and their stories—no argument there. But it does have blind spots, and in the field (or on a screen full of seismic lines), those blind spots matter.
One recurring challenge shows up when the record is, frankly, patchy. Poorly preserved or incomplete successions—intervals with big erosional cuts, non-depositional pauses, or both—can blur or erase the very surfaces we’re trying to map. You think you’ve got a tidy sequence boundary, then an unexpected scoured contact steals the correlation thread three wells over; the key surfaces stop being “key” and start feeling provisional. In other words, identifying and correlating system tracts and bounding surfaces gets tricky when the archive itself is discontinuous.
Another issue creeps in after deposition. Post-depositional processes—diagenesis in particular—can rework the mineralogy, the texture, and the pore architecture of the rock. That reshaping is not just cosmetic: it changes rock physics. The same interval that looked “clean” in core may respond differently to seismic (or logs) because cementation, dissolution, or compaction has altered velocities and impedances. So the stratigraphic signal is there, but, well… it’s wearing a different jacket.
And yet—despite those limitations—sequence stratigraphy keeps earning its place. It helps us piece together basin fills, predict facies shifts, and frame risk around reservoir presence and quality. It’s not perfect (no single method is), but it has pushed our understanding of Earth’s history and subsurface processes forward in a way few frameworks have. For reservoirs—conventional or otherwise—it remains a backbone approach, likely to stay central as new datasets arrive and as we, again, refine the playbooks.
Small aside: the future probably looks less like replacing sequence stratigraphy and more like upgrading it—tighter links to rock physics, more robust uncertainty handling, and models that accept messy data without flinching.
Integration with Other Disciplines
Sequence stratigraphy shines when it has company. On its own it offers patterns of stacking, accommodation changes, and surfaces; paired with other lenses, those patterns get context.
- Paleontology (and biostratigraphy)
Fossils constrain time and environment. Microfossil assemblages, for instance, can flag marine incursions or shifts in salinity and temperature—useful when a surface could be either a flooding surface or just a local facies quirk. It’s the difference between “looks marine” and “is definitively open-marine here.” - Geochemistry
Isotopes, elemental ratios, and biomarkers help separate provenance signals from diagenetic overprints. They can tie specific parasequences to source variations or redox changes, and they test whether that porosity “sweet spot” is depositional or the product of later fluids. Sometimes both, awkwardly. - Geophysics
Seismic stratigraphy extends the framework across the basin. Reflection terminations (onlap, downlap, toplap) anchor surfaces at scale, while rock-physics-informed inversions connect facies predictions to elastic properties. Even where resolution pinches out thin packages, consistent seismic geomorphology can still sketch the story.
Put together, these threads tighten the weave. You move from “a plausible stacking pattern” to a more defensible, time-aware depositional model. That sharper picture informs a lot of decisions—hydrocarbon exploration and appraisal, sure, but also groundwater management, CO₂ storage screening, mining, and environmental restoration. The thing is, integration rarely feels tidy; datasets disagree, time markers slip, and someone’s favorite surface refuses to correlate. That’s normal, and it’s useful—those disagreements are where the model learns.
What This Means in Practice
- Expect gaps and overprints. Build correlations that can tolerate missing beats and diagenetic detours.
- Lean on multiple lines of evidence. Fossils, geochemistry, and geophysics each “see” the basin differently; together they reduce the guesswork.
- Keep rock physics in the loop so your stratigraphic picks talk to the seismic response (and vice versa).
- Embrace uncertainty explicitly—alternative surface picks, scenario maps, and ranges for timing and facies. Clarity over false precision.
Honestly, sequence stratigraphy remains a powerful, practical language for the subsurface. Sometimes it rambles, sometimes it contradicts itself, but it keeps pointing us toward how and why sedimentary basins fill the way they do—and where the good rock might be, which is, again, the point.
Advancements in Technology
Advances in the toolset have honestly changed how geologists “see” basins and sequences. Take 3D seismic: instead of squinting at flat lines and guessing what dips under what, you’re looking at a volume—an actual cube—so channels, clinoforms, and subtle truncations pop where they used to hide. The spatial relationships between units feel less abstract and more, well… there. You can trace the geometry and distribution of depositional sequences with a lot more confidence, and, when you get lucky, you spot those quiet stratigraphic traps that used to slip through the cracks.
High‑resolution stratigraphy adds the fine brushwork. Using specialized logging tools and lab methods to track thickness, composition, and even grain‑scale shifts, you can separate beds that once seemed inseparable. Bed‑to‑bed characterization inside a single sequence suddenly makes sense; you watch sedimentation change through time instead of reading it second‑hand. It’s the difference between a map and a walk on the outcrop, you know?
Then there’s modeling and simulation—less magic, more sandbox. Build a virtual basin, turn the knobs on supply, accommodation, sea‑level, and let it run. You see how deltas step forward, how carbonate factories shut down, how erosion chews back a shelf edge that looked stable (it never is). These synthetic experiments don’t “prove” anything alone, but they do stress‑test your hypotheses and show which variables actually matter in a given environment, again and again.
Put together, the tech tightens the lens and widens it at the same time. Detail improves—tiny onlaps, subtle erosional surfaces, thin flooding shales that control pressure behavior—while the big picture clarifies: why a sequence formed, why it pinched out, why a reservoir sweet spot migrated twenty kilometers to the south. I still remember loading a 3D cube late one evening, scrolling inline by inline, and watching a meandering channel belt stitch itself across the volume; the geometry explained the production data better than a dozen memos ever did.
The thing is, none of this replaces field sense or core under the fingertips. But the precision we have now—acquisition, processing, logs, models—lets us connect process to product with far fewer leaps of faith, and a few more measurable links. It makes Earth’s history feel less like a puzzle with missing pieces and more like a story we can actually follow, comma and all.
Think of the rock record as a library that’s been shuffled, soaked, tilted, and—somehow—still readable if you know where to look. Sequence stratigraphy is the habit we use to read it well. We don’t inspect every grain; we group the story into chapters—packages of sediment bounded by surfaces we can trace—and then we ask the simple, annoying question: what changed here? Was it sea level; was it sediment supply; was it subsidence? Usually it’s a tug‑of‑war among all three, and rarely polite.
Why bother? Because those chapters steer where fluids live and how they move. If you map basins, chase water or hydrocarbons, plan CO₂ storage, or just want a cleaner narrative in messy rocks, you’re already doing sequence stratigraphy (even if you don’t call it that). A single missed surface can send a reservoir model sideways; a well‑placed one can pull it back together in an afternoon.
We’ll start with the basics: accommodation versus sediment flux, the stacking patterns we love to sketch (prograding, aggrading, retrograding), and the familiar systems tracts that track falling, rising, and high stands of relative sea level. Then we’ll get practical. Tools range from seismic reflections and well logs to cores and outcrops—and sometimes it’s just you, a notebook, and a stubborn cliff face while the light is good. Correlation hinges on surfaces you can actually follow, plus age control when fortune smiles: fossils, ash beds, the odd radiometric date that finally nails it.
Expect real‑world use cases: tighter reservoir models, better seal predictions, cleaner groundwater targeting, even de‑risking strat‑bound minerals. We’ll ground it with a few short case sketches—what clicked, what didn’t, and that one horizon that refused to behave no matter how nicely we asked. If you’ve ever tried to line up channel bodies across a wadi wall, you know the feeling.
There are snags, of course. Surfaces can be diachronous; eustasy, tectonics, and autogenic noise love to impersonate each other; scale blurs patterns we thought we understood at the well but lose in the seismic, or the other way around. And the terminology—well… sometimes it helps, sometimes it gets in the way.
Looking ahead, the edge comes from better dating (more precise chronologies), richer 3‑D/4‑D models, and drone‑to‑seismic integration that ties outcrop textures to subsurface geometry. Workflows are getting more quantitative, too—stress‑testing ideas instead of merely naming them, which is, honestly, healthier science. Put simply, as our tools improve and our datasets thicken, sequence stratigraphy doesn’t fade into the background; it gets sharper, more useful, more testable. And that means a clearer read on how sediments were laid down, how sequences stack and break, and—quietly but importantly—how Earth wrote its history in rock.